Management Studio Improvements in SQL Server 2008
DBAs have never really taken to SQL Server Management Studio (SSMS) with enthusiasm. However, SQL Server 2008 has brought with it a multitude of improvements to SSMS, which are intended to make it a little easier and more convenient to use.
I originally intended to include in this article every new change I could find, but I had to give up. There are so many improvements that it would take a short book to cover them all. No, this is not to say that Microsoft has changed SSMS so much that you will have to relearn it. SSMS is essentially the same tool we learned when it was first introduced with SQL Server 2005. On the other hand, it includes many new features and enhancements that make performing the routine tasks of a DBA a little easier. In addition, SSMS has gotten a speed boost, thanks to faster communications between SSMS and the SQL Server engine.
Here is what I consider to be some of the most important improvements in SSMS 2008:
- Activity Monitor
- Object Explorer Details
- Object Search
- Multi-Server Queries
- Intellisense Added to the Query Editor
- T-SQL Debugger Added to the Query Editor
Besides these key new features, there are other hidden gems that I hope you discover for yourself when you begin using SQL Server 2008 SSMS.
Activity Monitor
In SQL Server 2005, it was easy to find and start the Activity Monitor. You just opened up the Management object in SSMS and double-clicked on Activity Monitor, and you could instantly view process information. In SQL Server 2008, they have made the Activity Monitor a little harder to find, but once you have learned where it is, you will probably be very impressed with all the new features that have been added.
To start Activity Monitor in SQL Server 2008 SSMS, right-click on the SQL Server name you want to monitor, and then click on Activity Monitor. The following screen appears:
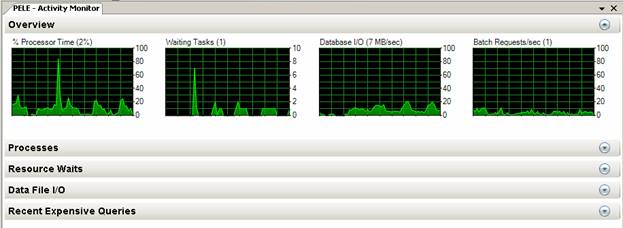
Figure 1: The Activity Monitor has had a radical facelift, and feature boost.
Immediately, you can see that Activity Monitor looks entirely different than in SQL Server 2005. The first things that jump out at you are the four graphs. These display % Processor time (of the SQL Server process “sqlserv ” spread over all of the available CPUs, not for the entire server), Waiting tasks, Database I/O, and Batch Requests/sec. In the past when you needed this information, you had to use System Monitor or some other tool. Now, if your server is behaving strangely and you need a quick overview of what is happening, you can get it directly from Activity Monitor.
Below the graphs you will find four additional windows of information, the first of which (Processes) is shown in Figure 2:
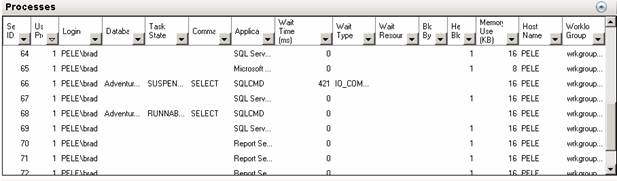
Figure 2: This looks a little more familiar. Here, we see all of the active SPIDS.
When you open the Processes window, you see the SPIDs that you are so familiar with from the SQL Server 2005 SSMS Activity Monitor. Now, not only can you see the SPIDS, and sort them, but you can also filter on them using the drop-down boxes at the top of each column. And if you right-click on any of the SPIDs, you can choose to automatically launch Profiler, which will begin a trace on the SPID in question. This makes it very easy to begin a Profiler analysis of any SPID that you want to investigate.
Next, we move on to the Resource Waits window, shown in Figure 3:
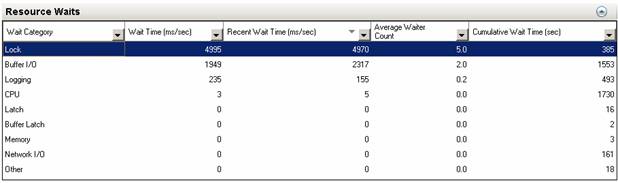
Figure 3: We can see the current wait states of active threads.
The ‘Resource Waits’ screen provides a snapshot of key resource waits occurring on the server, thereby helping you to identify potential trouble with your SQL Server. Resource waits measure the amount of time a worker thread has to wait until it can gain access to the resources on the server that it needs, such as memory or CPU. A high resource wait time might indicate a resource bottleneck. As with Processes, you can sort and filter on any column.
The third window is Data File I/O, as shown in Figure 4:
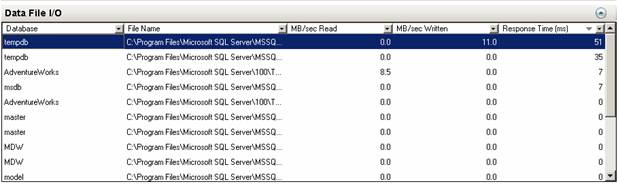
Figure 4: Use the Data File I/O screen to identify databases with heavy I/O activity.
If you suspect that a particular database is being heavily hit with disk I/O, you can quickly find out by using the Data File I/O screen. You can sort and filter on any column with this or the other related screens.
The final screen is "Recent Expensive Queries":
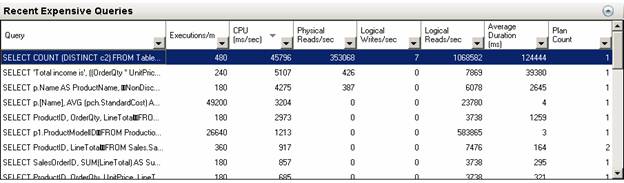
Figure 5: Want to know what your most expensive queries are? Find out here.
If you are having performance problems due to resource-intensive queries, then the Recent Expensive Queries window will show you the most recent expensive queries (those currently in cache), allowing you to sort or filter them by any column, making it easy to identify problem queries. If you right-click any of the queries, you have the option of displaying the entire query (not just the small part of the query you see in the window) and you also have the option of displaying a graphical execution plan of the query.
Another feature that you might miss, if you are not careful, it the use of Tool Tips throughout all the screens of the Activity Monitor. If you move the cursor on top of almost any text on the Activity Monitor screen, a Tool Tip will appear, providing you with useful information on what you are seeing. Most of the data displayed in the Activity Monitor are from DMVs. Many of the Tool Tips even tell you the name of the DMV used to return the data you are viewing.
When you first lay hands on a copy of SQL Server 2008, you should start by trying out the new Activity Monitor. I guarantee it will make it much easier for you to quickly get a high-level perspective on what might be ailing your SQL Server. Once you know the big picture, then you can use other tools, such as DMVs, Profiler, or System Monitor, to drill down for more details.
Object Explorer Details
In SQL Server 2005, the Object Explorer’s ‘Details’ screen, the one that appears by default to the right of the Object Explorer, wasn't particularly useful. Essentially, it just displayed the same information that you saw in the Object Explorer and I generally closed it because it didn't offer me any value.
This has changed in SQL Server 2008. Instead of repeating what you see in Object Explorer, you are generally presented with a lot of useful information about the object selected in Object Explorer. The level of detail depends on which object in the Object Explorer you have selected. For a quick demo, let's take a look at the Object Explorer Details window when "Databases" has been selected in the Object Browser.
Note
If the Object Explorer Details window does not appear by default when the Object Explorer is displayed, either press the F7 key, or select "Object Explorer Details" from the "View" menu.
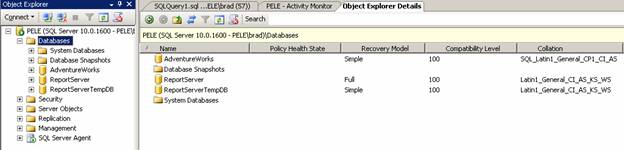
Figure 6: The Object Explorer Details screen can provide detailed information about many of the objects found in the Object Explorer.
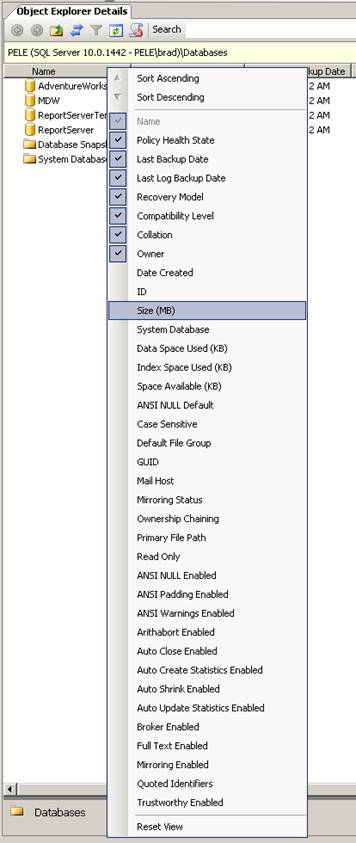
Figure 7: You can display up to 36 different columns of information about each database.
When I click on "Databases" in Object Explorer, I can see in the Object Explorer Details screen a variety of information about each of the databases, such as its Policy Health State, Recover Model, Compatibility Level, Collation, and so on. Notice the small folder icons next to System Databases and Database Snapshots in figure 6 above. Since these are represented as folders, you can click on these to drill down for additional information.
By default, five columns of data are displayed for each database, although you can only see four in figure 6 because of the lack of room. But what is really cool is that you are not limited to only five columns of data. If you right click on any of the column headings, you get a drop-down box, see figure 7, which allows you to select up to 36 different columns to be displayed. In addition, you can sort any of the rows, and you can move them in any order you prefer.
Any changes you make are automatically remembered, so the next time you come back to this screen, it will appear just like you left it, as you see if figure 8.
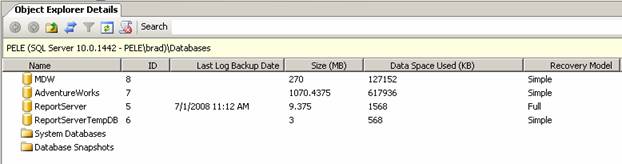
Figure 8: I have rearranged the screen to better meet my needs and interests. Notice that I have listed the Database ID right after the database name. Now I no longer have to look up the ID whenever I need it.
What if you decide that 36 rows of data are too much to deal with inside of SSMS? One option would be to select all of the rows displayed in the Object Explorer Details screen you want to work with, then press CTRL-C, and all of the data is copied to the clipboard in the tab-delimited format, and then you can paste the results directly into an Excel spreadsheet, and voila, you have an instant report describing the current state of all your databases.
As you can see, the Object Explorer Details window has lots of potential for quickly assessing the status of any of your databases.
Object Search
If you looked closely at the past several screen shots, you probably noticed the search box shown in Figure 9:
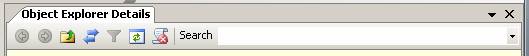
Figure 9: I bet you can guess what this search box does.
Technically speaking, the Object Search box is part of the Object Explorer Details window, but it works independently of the window. Let me show you what I mean. Let's say that I want to find all the objects, in all the databases on my SQL Server instance, which include the word "currency". To do this, I would enter into the search box %currency%. The percent signs on either side of the word are wildcard symbols, which mean that any object in all my databases that includes the word "currency" will be found, as you can see in figure 10:
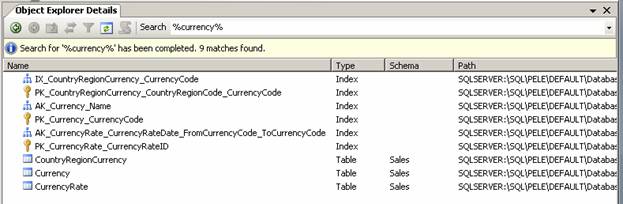
Figure 10: You can search for any object using the Search box.
When the search is complete, all objects that contain the word "currency" are displayed, along with their object type, schema name (if applicable), and the path to the object (most of the path has been cut off from figure 10).
Of course, you don't have to use wildcards if you don't want to, but I wanted to show you the power of this feature. One thing to keep in mind about object searching is that the scope of the search depends on what object has been selected in the Object Explorer. If you want to search all databases, then you need to select the "Databases" object. If you only want to select objects for a specific database, then first select that specific database from Object Explorer, and then perform the search. This way, you only get results from the database you are interested in searching.
In the past, finding objects by name was not intuitive or easy. Now, with Object Search, you can quickly find objects on your SQL Server instances.
Multi-Server Queries
While third-party tools have been offering this feature for years, SSMS now offers the ability to query multiple servers at the same time, returning the results to a single window. This makes it very easy for DBAs to run the same script on multiple SQL Server instances simultaneously.
To accomplish this task, the first step is to create a Server Group from the Registered Servers window, then add SQL Server registrations to the group. Next, right-click on the Server Group and select "New Query." A new Query Editor window appears, where you can enter Transact-SQL code. When you click on "Execute," the query runs on all the registered servers belonging to the group, and returns the results in a single window.
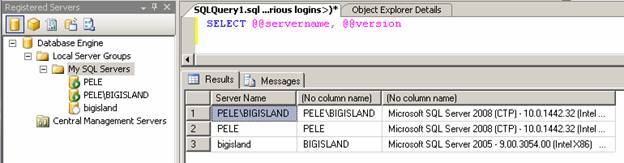
Figure 11: You can now query multiple servers from the same Query Editor window.
In the left-hand pane of figure 11, there is a Server Group named "My SQL Servers" that has three registered servers in it. I right-clicked on the "My SQL Servers" group, and a new Query Editor window opened. I then entered a short query and executed it. As you can see, the names and versions of each of my servers were returned. This feature is backward-compatible with SQL Server 2005.
If you want to query just a selection of SQL Servers, rather than all of the SQL Servers you manage, you will need to create separate Server Groups for each subset, and then add the appropriate servers to the groups. If need be, a SQL Server instance can be a member of more than one Server Group. As a result, you have the facility to create Server Groups, to define sets of servers in any combination that you require, in order to control precisely on which SQL Server instances your queries will execute.
IntelliSense Added to the Query Editor
One of the most requested features for the SSMS Query Editor has been IntelliSense, and it's finally available in SQL Server 2008, although it does not provide all the features you may have become accustomed to when using Visual Studio or third-party add-ins. For example, it only works with SQL Server 2008 and is not backward compatible with SQL Server 2005, nor does it provide advanced formatting capabilities, or refactoring.
While there are some DBAs who have every Transact-SQL statement and parameter memorized, I'm not one of them. This means that I often spend a lot of time in Books Online looking up the syntax of a particular statement. The addition of IntelliSense reduces my need to refer to Books Online, and so helps me to write code faster, and more accurately (the first time).
Figure 12: Syntax errors become obvious very quickly when they have a red underline underneath them.
You don't have to do anything to use IntelliSense in the Query Editor. All you have to do is to begin typing. As you type, IntelliSense can automatically:
- Identify incorrect syntax, underlining it in red so you can immediately identify and correct it.
- Complete a word as you type in a variable, command, or function once you have typed in enough characters so that it is uniquely identified.
- List the available parameters required by a function or stored procedure.
- Open a list that provides available database objects and user-defined variables that you have previously declared.
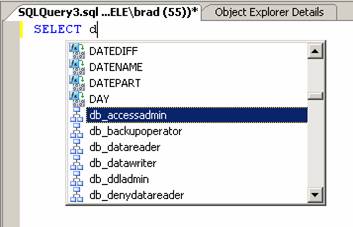
Figure 13: IntelliSense helps you to complete variables, commands, or functions as type them in.
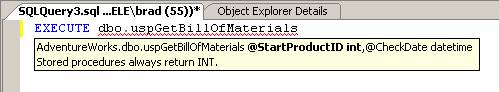
Figure 14: IntelliSense can tell you what parameters are needed for a function or a stored procedure.
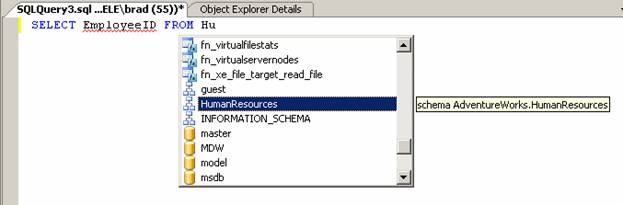
Figure 15: Under some conditions, IntelliSense can provide a list of available objects you can select from.
Using IntelliSense can take a little time to get used to, but once you do, you will find that it can help boost your Transact-SQL coding performance.
T-SQL Debugger Added to the Query Editor
Another feature that has been sorely missing from SQL Server 2005 is a query debugger. In SQL Server 2008, a debugger is now integrated within the Query Editor, making it easy for you to debug your Transact-SQL code.
The debugger includes many features, including the ability to:
- Step through Transact-SQL statements, line by line, or by using breakpoints.
- Step into or over Transact-SQL stored procedures, functions, or triggers that are part of your code.
- Watch values assigned to variables, in addition to viewing system objects, including the call stack and threads.
To use the debugger, all you have to do is to add the code you want to debug to a Query Editor window, then click on the green debug arrow (next to Execute on the Query Editor tool bar), click ALT-F5, or go to the "Debug" menu option and select "Start Debugging." At this point, the Query Editor starts the debugging process, and you can use any of the features previously described to step through your code, looking for potential problems.
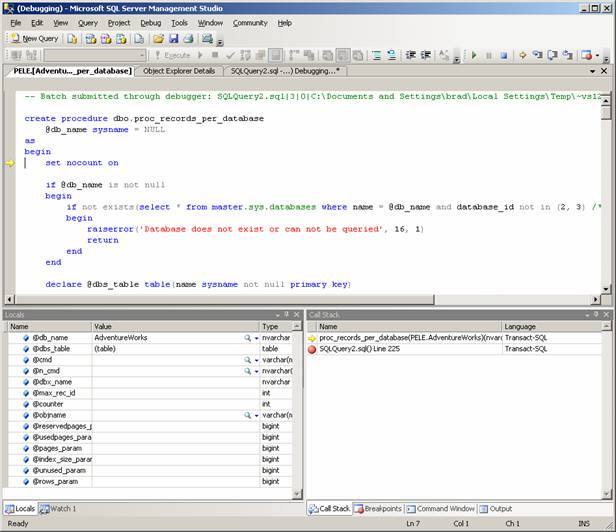
Figure 16: Transact-SQL is currently being debugged.
If you have not used a debugger before, then it might take some time getting used to, as you have the learning curve of understanding exactly how the debugger can be used, besides learning the proper techniques. If you have used a debugger before, you should be able to begin using it immediately, as its features are very straight-forward for the experienced developer.
Keep in mind that the debugger should only be used on test servers, not on production servers. This is because debugging sessions may take some time to complete, and often during debugging sessions, locks are acquired and may be held by the debugging session for long periods of time.
Summary
This ends our brief look at some of the new, cool features added to the SQL Server 2008 SSMS. All of these features are available in all editions of SQL Server 2008 that come with SSMS. As you can imagine, this is just a sampling of the many new improvements made to SSMS. When you first start using SQL Server 2008 SSMS, the first thing you will want to do is to spend extra time learning about all these features, and the many more that I did not have time to discuss. By investing time upfront, you will more quickly be able to master the new features, making you that much more productive right at the start.